Category Archives: Studies

Fentanyl Is the Deadliest Drug

Fentanyl Is Causing Almost Half of All Overdose Deaths, Research Shows |  Fortune


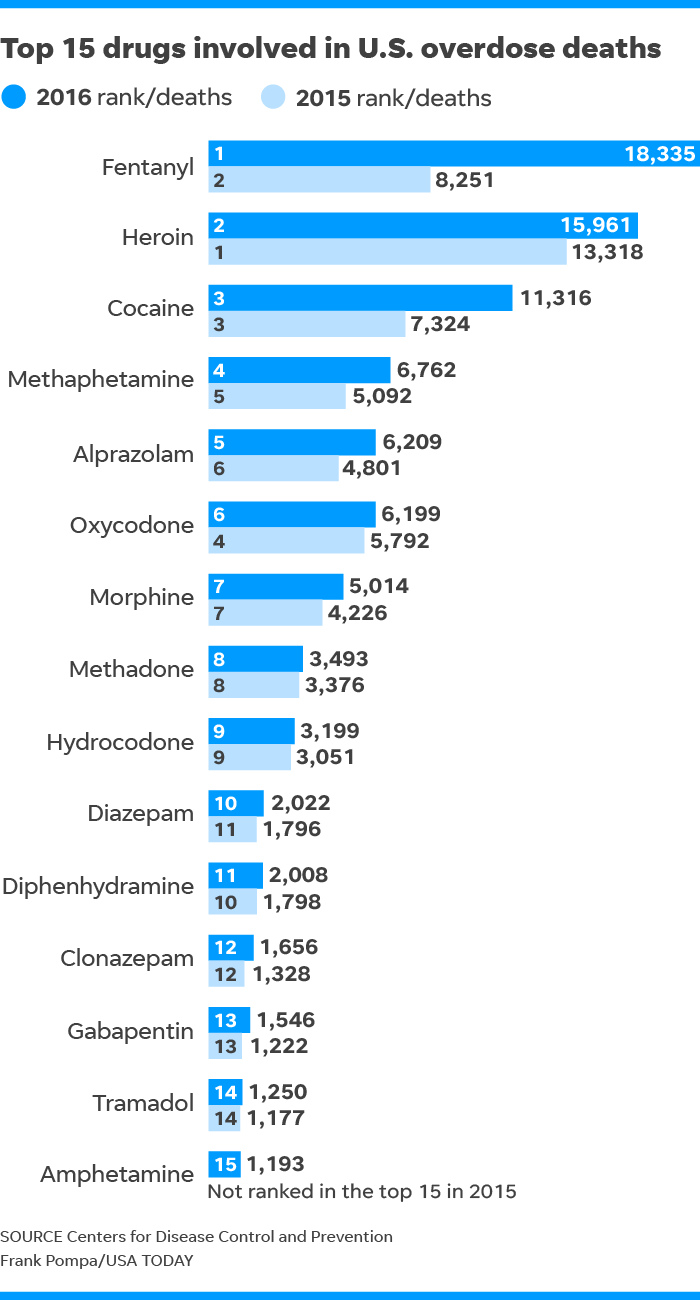
Excellent article by  of USA Today discussed a recent report from the from the Centers for Disease Control and Prevention finding that Fentanyl is now the deadliest drug in America, with more than 18,000 overdose deaths in 2016, the most recent year for which statistics are available.

It’s the first time the synthetic opioid has been the nation’s deadliest drug. From 2012 to 2015, heroin topped the list.

For those who don’t know, fentanyl is a synthetic opioid that is 80-100 times stronger than morphine. Pharmaceutical fentanyl was developed for pain management treatment of cancer patients, applied in a patch on the skin. Because of its powerful opioid properties, Fentanyl is also diverted for abuse. Fentanyl is added to heroin to increase its potency, or be disguised as highly potent heroin. Many users believe that they are purchasing heroin and actually don’t know that they are purchasing fentanyl – which often results in overdose deaths.

On average, in each year from 2013 to 2016, the rate of overdose deaths from Fentanyl increased by about 113 percent  a year.  The report said fentanyl was responsible for 29 percent of all overdose deaths in 2016, up from just 4 percent in 2011.

Overall, more than 63,000 Americans died of drug overdoses in 2016, according to the report, which was prepared by the National Center for Health Statistics, part of the U.S. Centers for Disease Control and Prevention.  That’s an average of 174 deaths  a day.

The study also said many people who die from overdoses have multiple drugs in their system. “We’ve had a tendency to think of these drugs in isolation,” Dr. Holly Hedegaard, lead author of the report, told HuffPost. “It’s not really what’s happening.”

As an example, roughly 40 percent of people listed as dying of a cocaine overdose also had fentanyl in their system.

After fentanyl, heroin, cocaine and methamphetamine were the deadliest drugs in 2016. After declines earlier in the decade, the report said, overdose deaths from both cocaine and methamphetamine were starting to rise again.

The study said illegal drugs such as fentanyl and heroin were the primary causes of unintentional overdoses, while prescription drugs such as oxycodone tended to be used in suicide overdoses.

Drug abuse is terribly destructive and deeply affects addicts, families and society. However, please contact my office if you, a friend or family members are charged with a drug crime. The Fourth Amendment guarantees the right against unlawful search and seizure. Perhaps some well-argued pretrial motions can become part of an aggressive defense against pending drug charges.

Please contact my office if you, a friend or family member are charged with a crime, including Drug Charges. Hiring an effective and competent defense attorney is the first and best step toward justice.

Stricter Immigration Enforcement Will Not Reduce Crime

Image result for immigrants and crime

Interesting article released from The Hill by authors Nazgol Ghandnoosh and Alex Nowrasteh claims that recent research shows that immigrants—regardless of legal status—commit property and violent crimes at lower rates than native-born citizens.

This research, conducted independently by The Sentencing Project and the Cato Institute, used different methods but arrived at the same conclusion: Immigrants are less crime-prone than native-born citizens.

Overall, non-citizens are actually slightly underrepresented in prisons, comprising six percent of the prison population compared to their seven percent of the total U.S. population.

“Effectively addressing violent and property crime requires approaching the problem with both eyes open and without fear of the facts. Law enforcement has scarce resources. Sending them on wild goose chases to round up undocumented immigrants will only deter those individuals and those close to them from reporting crimes and cooperating with investigations.”

Nazgol Ghandnoosh is a research analyst at The Sentencing Project and the co-author of the report Immigration and Public Safety. Alex Nowrasteh is an immigration policy analyst at the Cato Institute and a co-author of the report Criminal Immigrants: Their Numbers, Demographics, and Countries of Origin.

My opinion? This certainly is a highly politicized and hot-button topic. Hopefully, we’ll all arrive at solutions which do not unlawfully violate people’s constitutional rights, regardless of their immigration status.

Please contact my office if you, a friend or family member are charged with a crime; regardless of immigration status. Hiring a knowledgeable, effective and experienced criminal defense attorney is the first step toward getting justice in our courts.

Bellingham’s Most Dangerous Intersections

Informative article by David Rasbach of the Bellingham Herald reports on statistics provided by the Bellingham Police Department Traffic Division showing Bellingham’s most dangerous intersection.

Apparently, at least in terms of the sheer number of accidents, West Bakerview Road and Northwest Drive reigns as the most dangerous intersection in the city.

In a distracted driving study conducted by its traffic division from January 2016 through June 2017, Bellingham Police received 1,350 reports of accidents within city limits, regardless of severity or injury. Of those, 43 accidents occurred at the intersection of Bakerview and Northwest — the highest total of any intersection in town.

Rasbach also reports that three of the top four most dangerous intersections during the 18-month study were in that same corridor: West Bakerview Road and Eliza Avenuehad the third highest accident total with 22 wrecks, while West Bakerview Road and Cordata Parkway was fourth highest with 18.

The only intersection breaking up Bakerview’s stranglehold on the top of Bellingham’s dangerous intersections list — Lakeway Drive and Lincoln Street, which had 25 reported accidents — is very similar, with two busy shopping centers and a school occupying three of the four corners. Nearby Lakeway Drive and King Street tied for sixth-most dangerous with Woburn Street and Barkley Boulevard with 14 reported accidents, each.

Also, the lone roundabout at Cordata Parkway and West Kellogg Road had 16 accidents reported.

Please contact my office if you, a family member or friend are criminally charged for traffic-related incidents. Unfortunately, it’s very easy to be charged with DUI, Reckless Driving, Negligent Driving, Driving While License Suspended, Eluding and/or numerous traffic citations. Bellingham’s dangerous intersections only exacerbate the situation and make it more likely that an unlawful pretextual pullover will happen.

Most of all, drive safe!

Speeding / Reckless Driving

Reckless Driving 101 - Speeding Tickets, Fines and Penalties

Interesting article by Robert Mittendorf of the Bellingham Herald discusses the increased dangers of speeding and Reckless Driving in Washington and Whatcom County.

Apparently, the WA State Patrol has aircraft and personnel dedicated to surveying and catching motorists  who drive recklessly. WA State Patrol Traffic Aircraft

According to a report from personal finance website WalletHub, Washington is first among U.S. states where speeding is automatically considered Reckless Driving, seventh in average cost increase of insurance after one speeding ticket, and tenth for minimum jail time for a first Reckless Driving offense.

Mittendorf reports that in Washington, a first-time Reckless Driving is a gross misdemeanor conviction which could result in a year in jail, a $5,000 fine and a suspended license. And according to Mittendorf, even though speeding alone is legally considered reckless driving in Washington, a police officer won’t always add reckless charge to a speeding ticket, said Trooper Heather Axtman of the Washington State Patrol.

Mittendorf also reports that CarInsurance.com says a speeding ticket could result in a 10 percent increase in insurance premiums for three to five years, depending on the company and other factors, including how long the policy holder has been a client.

Please contact my office if you, a friend or family member are charged with driving-related crimes in Skagit and Whatcom county.

Murder Rates Decline

Cyber Attacks Are Killing Hospital Patients: Could Cybercriminals Be  Prosecuted for Murder? - Hashed Out by The SSL Store™

Wonderful article by German Lopez of Vox discusses how crime and murder rates generally declined in the U.S.’s 30 largest cities in 2017, following two years of sharp increases in the murder rate nationwide.

According to a new report by the Brennan Center for Justice, the overall crime rate fell in the 30 largest cities by 2.1 percent compared to 2016, the violent crime rate by 1 percent, and the murder rate by 3.4 percent.

“Large decreases in Chicago and Houston, as well as small decreases in other cities, contributed to this decline [in the murder rate],” researchers Ames Grawert, James Cullen, and Vienna Thompkins wrote.

One caveat to the findings: Murder rates in some US cities, including Chicago, remain elevated compared to a couple of years ago. “The murder rate in Chicago, which increased significantly in 2015 and 2016, declined by 12.3 percent in 2017, but remains more than 60 percent above 2014 levels,” the report found.

And some cities, including Philadelphia, Indianapolis, and Baltimore, did see increases in the murder rate in 2017. This kind of local variance and fluctuation is typical in US crime statistics: Even as national trends head in one direction, that doesn’t mean all cities and states always follow the same path.

According to Lopez, the report updated Brennan’s preliminary findings from December, broadly reaching the same conclusions.

The full official numbers for the entire US, compiled by the FBI, will come out later this year. Lopez reasons that generally, though, the Brennan Center’s reports have done a good job predicting national trends in the past few years. And the news, overall, is good.

Lopez says the past two years’ increases in the murder rate got a lot of attention, with President Donald Trump and Attorney General Jeff Sessions often bringing them up in speeches to justify “tough on crime” policies. But before they’ve been able to implement such policies and let them take root (especially in local and state jurisdictions, where federal policymakers have very limited power), these rates appear to be coming down.

Lopez says criminologists still aren’t sure why murder in particular appeared to spike so much in 2015 and 2016. Some argued that there might have been a “Ferguson effect,” named after the city in Missouri that exploded into protests over the police shooting of Michael Brown: Due to protests against police brutality over the past few years, police were, the theory goes, scared off from doing proactive policing, emboldening criminals.

Other experts argued a different kind of Ferguson effect: Widely reported incidents of police brutality and racial disparities in police use of force led to elevated distrust in law enforcement, which makes it much harder for police to solve and prevent crimes.

Yet many criminologists cautioned that it’s also possible the two years’ increases were blips in the data, not a new long-term trend. This isn’t unprecedented; in 2005 and 2006, the murder rate in the US increased before continuing its long-term decline — to new record lows — in the ensuing years.

“It now looks possible — though we’ll need more years of data to confirm — that 2015 and 2016 were replays of 2005 and 2006. If that holds, then perhaps the US isn’t in the middle of the “American carnage” that Trump warned about.”

Since the murder rate in particular is generally low, it’s prone to big statistical fluctuations. As one example, Brennan found that Las Vegas saw a 23.5 percent spike in its murder rate last year, but that was due to the mass shooting at a country music concert there that killed 58 people. A single event, albeit a very bad one, led to a dramatic shift in the murder rate.

“That’s why criminologists generally demand several years of data before they declare a significant crime trend,” said Lopez.

Please contact my office if you, a friend or family member are charged with a crime. Hiring an effective and competent defense attorney is the first and best step toward justice.

Studies Show Immigration Does Not Increase Violent Crimes

Image result for immigration violent crime

Informative article from John Burnett of NPR discusses four academic studies showing that illegal immigration does not increase the prevalence of violent crime or drug and alcohol problems.

Michael Light, a criminologist at the University of Wisconsin, looked at whether the soaring increase in illegal immigration over the last three decades caused a commensurate jump in violent crimes: murder, rape, robbery and aggravated assault.

“Increased undocumented immigration since 1990 has not increased violent crime over that same time period,” Light said in a phone interview.

Those findings are published in the current edition of the peer-reviewed journal Criminology.

In a separate study, these same researchers previously looked at nonviolent crime. They found that the dramatic influx of undocumented immigrants, similarly, did not drive up rates of drug and alcohol arrests or the number of drug overdoses and DUI deaths.

“We found no evidence that undocumented immigration increases the prevalence of any of those outcomes,” Light said.

third study, by the libertarian Cato Institute, recently looked at criminality among undocumented immigrants just in Texas. The state records the immigration status of arrestees, creating a gold mine for criminologists.

Cato found that in 2015, criminal conviction and arrest rates in Texas for undocumented immigrants were lower than those of native-born Americans for murder, sexual assault and larceny.

Finally, a research paper appearing in the current edition of the U.K. journal Migration Letters shows that youthful undocumented immigrants engage in less crime than do legal immigrants or U.S.-born peers.

According to reporter Burnett, social science has focused on the extent of crime committed by legal immigrants for decades. These new studies are important because they’re among the first to explore the link between crime and illegal immigration.

However, Burnett also indicates that the new research may not move the needle in the immigration debate. Texas Republicans, for instance, have potent opinions about undocumented immigrants. A recent poll showed that 7 out of 10 GOP voters in Texas support the proposition that all undocumented immigrants should be deported immediately regardless of whether they have committed a crime there.

My opinion? Immigration certainly is a hot-button political issue. Hopefully, the research is exposing some critical truths which may shed light on the issues and change the narrative.

Please contact my office if you, a friend or family member are charged with a crime. Hiring an effective and competent defense attorney is the first and best step toward justice.
5 Types of Alcoholics

Alcoholism, Alcohol Misuse, and Alcohol Dependence

Apparently, there are several types of alcoholics.

Scientists at the National Institute on Alcohol Abuse and Alcoholism (NIAAA) conducted a survey of 43,093 individuals, screening them for alcohol dependence as well as a wide range of other factors. The NIAAA researchers found that there were five distinct patterns of alcohol dependence.

YOUNG ADULT SUBTYPE

This is the most prevalent subtype, making up 31.5 percent of people who are alcohol dependent. The average age of dependent young adults is 25 years, and they first became dependent at an average of age 20. They tend to drink less frequently than people of other types (an average of 143 days a year). However, most of their drinking is binge drinking – they drink five or more drinks on an average of 104 (73 percent) of those days. On drinking days, the average maximum number of drinks is 14. This pattern of alcohol use is more likely to be hazardous than non-binging patterns.

Young adult alcohol dependents are 2.5 times more likely to be male than female. About 75 percent have never been married, 36.5 percent are still in school, and 54 percent work full time. Approximately 22 percent have a first- or second-degree family member who is also dependent on alcohol. Compared to other types of alcoholics, young adults are less likely to have psychiatric disorders or legal problems. Fewer than 1 percent of them have antisocial personality disorder. About 32 percent also smoke cigarettes, and 25 percent also use cannabis.

Only 8.7 percent of young adult alcohol dependents have ever sought treatment for their drinking problem. If they do choose to seek help, they tend to prefer 12-step programs over specialty treatment clinics or private professional practices.

The NIAAA reports that four out of five college students drink alcohol and half of those who do binge drink. They also note that each year, among college students between the ages of 18 and 24:

  • At least 1,825 students die from alcohol-related accidental injuries.
  • Over 690,000 students are assaulted by another student who has been drinking.
  • More than 97,000 students are victims of alcohol-related date rape or sexual assault.
  • About 599,000 students are unintentionally injured while they are under the influence of alcohol.
  • Over 150,000 students develop alcohol-related health problems.
  • About 25 percent of students experience school-related consequences from their alcohol consumption, such as being late to or missing classes, falling behind on coursework, doing poorly on homework, exams or papers, and receiving overall lower grades.

YOUNG ANTISOCIAL SUBTYPE

Young antisocial alcohol dependents make up 21.1 percent of alcoholics – 54 percent of them have antisocial personality disorder (ASPD). ASPD is characterized by at least three of the following:

  • Recurring criminal activities
  • Regular fights or assaults
  • Lack of regard for the safety of others
  • Lack of remorse
  • Impulsiveness
  • Deceitfulness
  • Irresponsibility

They are also young (average age 26 years), and they have the earliest age of onset of drinking (average 16 years) and the earliest age of alcohol dependence (average 18 years). Young antisocial alcoholics drank an average of 201 days in the last year, binge drinking (consuming five or more drinks) on an average of 161 (80 percent) of those days. When they drink, their maximum number of drinks is 17, the highest of any subtype of alcoholic.

About 76 percent of this type of alcoholic are male. Only 7.6 percent have received a college degree, although another 13.4 percent are still in school. Approximately 47 percent are employed full time. Family incomes average around $32,000, the lowest among the subtypes (alongside the chronic severe subtype).

Over half of young antisocial alcoholics (52.5 percent) have a close family member who is also alcohol dependent. In addition, they also have high rates of psychiatric disorders:

They also have high rates of substance abuse:

Almost 35 percent of young antisocial alcoholics have sought help for their alcohol-dependence problems. They tend to go to self-help groups, detoxification programs, and specialty treatment programs, and they have high rates of participation in treatments offered by individual private health care providers.

The NIAAA reports that alcohol and ASPD make for a dangerous combination. People with ASPD are 21 times more likely to develop alcohol dependence in their lifetimes. Meanwhile, alcohol is more likely to increase aggressive behaviors in people with ASPD than in people without. This may be because alcohol interferes with executive functioning in the brain, which regulates and inhibits aggressive behavior. People with ASPD also show impaired executive functioning, which may make them particularly vulnerable to this effect.

FUNCTIONAL SUBTYPE

Functional alcoholics make up 19.4 percent of alcohol-dependent individuals. This group tends to be older (average age 41 years), has a later age of first drinking (average 19 years), and a later onset of alcohol dependence (average age of 37 years). They tend to drink alcohol every other day (an average of 181 days per year), and they consume five or more drinks on an average of 98 (54 percent) of those days. On drinking days, they tend to consume a maximum of 10 drinks.

About 62 percent of functional alcoholics work fulltime, 3.6 percent are in school fulltime, and 5 percent are retired. Nearly 26 percent have a college degree or higher, and average household income is almost $60,000, the highest among any of the subtypes. Approximately 40 percent are female, and nearly 50 percent are married.

About 31 percent of functional alcoholics have a close family member who also has alcohol dependence. They have moderate rates of major depression(24 percent) and smoking cigarettes (43 percent), and low rates of anxiety disorders, other substance use disorders, and the lowest rates of having legal problems (fewer than 1 percent). Fewer than 1 percent of these individuals have antisocial personality disorder.

Only 17 percent of functional alcoholics have ever sought help for their alcohol dependence. Those who do tend to make use of 12-step programs and private health care professionals. Functional alcoholics make up 19.4 percent of alcohol-dependent individuals. This group tends to be older (average age 41 years), has a later age of first drinking (average 19 years), and a later onset of alcohol dependence (average age of 37 years). They tend to drink alcohol every other day (an average of 181 days per year), and they consume five or more drinks on an average of 98 (54 percent) of those days. On drinking days, they tend to consume a maximum of 10 drinks.

INTERMEDIATE FAMILIAL ALCOHOLICS

Intermediate familial alcoholics make up 18.8 percent of all alcoholics. Nearly half (47 percent) of them have a close family member who is also an alcoholic. They have an average age of 38 years, began drinking at almost age 17, and developed alcohol dependence at an average age of 32 years. Intermediate familial alcoholics drink on an average of 172 days a year, consuming five or more drinks on 93 (54 percent) of those days, with a maximum of 10 drinks.

They have the highest rates of employment among alcoholics, with 68 percent working full time and with an average family income of nearly $50,000 a year. Nearly 20 percent have a college degree. About 64 percent are male, while about 38 percent are married and 21 percent are divorced.

Intermediate familial alcoholics have elevated rates of mental illness:

They also have higher rates of substance use/abuse:

  • 57 percent smoke cigarettes
  • 25 percent have cannabis use disorder
  • 20 percent have cocaine use disorder

Almost 27 percent of intermediate familial alcohol dependents have sought help for their drinking problem. They tend to prefer self-help groups, detoxification programs, specialty treatment programs, and individual private health care providers.

CHRONIC SEVERE SUBTYPE

This is the rarest and most dangerous type of alcoholism, making up 9.2 percent of alcoholics. Chronic severe alcoholics average 38 years of age. They begin drinking early (at 16 years) and develop alcohol dependence later (around 29 years of age). This group has the highest rates of drinking, consuming alcohol on an average of 247.5 days a year and binge drinking on 172 (69 percent) of them, with a maximum of 15 drinks.

The majority of chronic severe alcoholics are male (65 percent). They also have the highest divorce rates, with 25.1 percent divorced and 8.6 percent separated, and only 28.7 percent married. Only 9 percent have a college degree, and they also have the lowest employment rate, with only 43 percent of chronic severe alcoholics employed full time and 7.6 percent both unemployed and permanently disabled.

Chronic severe alcoholics have the highest rate of family members who also experience alcohol dependence, at 77 percent. They are most likely to have mental illnesses:

  • 55 percent have depression
  • 47 percent have antisocial personality disorder (the second-highest rate, after young antisocial alcoholics)
  • 34 percent have bipolar disorder
  • 26 percent have social phobia
  • 25 percent have dysthymia
  • 24 percent have generalized anxiety disorder
  • 17 percent have panic disorder

Substance abuse is also common:

  • 75 percent smoke cigarettes
  • 58 percent have cannabis use disorder
  • 39 percent have cocaine use disorder
  • 24 percent have opioid use disorder

Chronic severe alcoholics experience the most pervasive symptoms:

  • Highest rate of emergency room visits related to drinking of any subtype
  • 94 percent drink larger/longer amounts than intended
  • 92 percent drink despite experiencing problems from drinking, such as at work, school, in relationships, or while driving
  • 88 percent experience withdrawal symptoms
  • 83 percent have repeatedly tried to reduce their drinking
  • 64 percent spend significant time recovering from drinking
  • 48 percent reduced meaningful activities, like hobbies or family time, because of alcohol

Almost 66 percent of chronic severe alcoholics have sought help for their alcoholism. They have the highest rates of attendance at self-help groups, detoxification programs, and specialty rehabilitation programs, and the highest rates of treatment in inpatient programs. When seeking treatment, they tend to turn to social workers, psychologists, psychiatrists, and private physicians.

Alcoholism is a debilitating disease. Making matters worse, it can lead people to commit crimes they otherwise would not commit. DUI is the perfect example of a crime which necessarily involves alcohol or drug abuse. Fortunately, there are defenses. Voluntary Intoxication and/or Diminished Capacity might apply. Please contact my office if you, a friend or family member suffer from alcoholism and are charged with a crime. Perhaps good defenses combined with hard work and strong dedication to a alcohol treatment program might persuade the Prosecutor to reduce or dismiss the charges.

Please contact my office if you, a friend or family member are charged with a crime. Hiring an effective and competent defense attorney is the first and best step toward justice.

Marijuana Use & Your Job

Can You Get Fired for Smoking Legal Weed?

Interesting article by Dr. Kelly Arps of abc news reports that a survey released by the Centers for Disease and Control Prevention (CDC) Thursday may help inform employers about marijuana use in their industry.

The Colorado Department of Public Health and Environment (CDPHE) analyzed data from the Behavioral Risk Factor Surveillance System (BRFSS) — a phone survey about health habits in general — and published a breakdown of marijuana use by industry and job.

Of the more than 10,000 workers surveyed, 14.6 percent answered yes to the question, “Did you use marijuana or hashish in the last 30 days?” They were not asked whether they used marijuana while on the job. Not surprisingly, use was more common in males and among young people, with nearly 30 percent of those in the 18- to 25-year-old age group reporting at least one use in 30 days.

Which profession smokes the most pot?

In the “accommodation and food services” industry, 30 percent of workers reported smoking pot at least once in the past month. Those in the job category “food preparation and serving” had the highest use at 32 percent of workers.

What other professions have a high proportion of marijuana users?

“Arts, design, entertainment, sports and media” came in second at 28 percent. Marijuana use was also reported by 19 to 21 percent of workers in “production,” “life, physical, and social science,” “sales and related,” and “installation, maintenance, and repair.”

What about people in high risk jobs?

While the study doesn’t reveal if anyone actually got high on the job, the researchers did take a special look at industries in “safety-sensitive occupations” in which workers are responsible for their own safety or the safety of others.

Those in construction, manufacturing, and agriculture industries all fell above the state average in percentage of workers reporting marijuana use. Notably, healthcare, utilities, or mining, oil, and gas all had less than 10 percent of their workers report marijuana use.

All three of these low-use industries are also those known to perform drug testing on employees.

Next steps: Workplace marijuana use policies

In states where marijuana use is legal, companies are currently left to their own judgment regarding workplace use.

Those with a policy that allows medicinal or recreational marijuana use during personal time will have difficulty interpreting a positive drug screen — was the employee high at work or does the result reflect his or her use last weekend?

Experts have suggested implementing standardized cognitive testing rather than drug screens for those approved to use marijuana while employed — or for those with a suspected marijuana-related workplace safety incident.

Marijuana use is frequently linked to mental health issues

Dr. Arps reports that if an employee is using marijuana, then employers should dig further.

“Is there anxiety, is there ADHD, is there depression?” said Dr. Scott Krakower. “If marijuana is there, what else are we missing? Are we meeting our employees’ needs?”

Dr. Arps also reports that federal law allows employers to prohibit employees from working under the influence of marijuana and may discipline employees who violate the prohibition without violating the Americans with Disabilities Act.

Several states have laws, however, which prohibit discrimination based on its use, citing evidence supporting the positive effects of marijuana on various health conditions.

“With widespread legalization, we will likely see publicized court cases surrounding these issues,” says Dr. Arps.

Please contact my office if you, a friend or family member are charged with a crime. Hiring an effective and competent defense attorney is the first and best step toward justice.
Drug Offender Recidivism

Image result for prison sentences for drug offences

A recent Pew Study suggests that imprisoning drug offenders for longer prison sentences does not reduce drug problems in any given state. In other words, there is no statistical data showing a relationship between prison terms and drug misuse.

To test this, Pew compared state drug imprisonment rates with three important measures of drug problems— self-reported drug use (excluding marijuana), drug arrest, and overdose death—and found no statistically significant relationship between drug imprisonment and these indicators. In other words, higher rates of drug imprisonment did not translate into lower rates of drug use, arrests, or overdose deaths.

The study found that nearly 300,000 people are held in state and federal prisons in the United States for drug-law violations, up from less than 25,000 in 1980. These offenders served more time than in the past: Those who left state prisons in 2009 had been behind bars an average of 2.2 years, a 36 percent increase over 1990, while prison terms for federal drug offenders jumped 153 percent between 1988 and 2012, from about two to roughly five years.

The study said that as the U.S. confronts a growing epidemic of opioid misuse, policymakers and public health officials need a clear understanding of whether, how, and to what degree imprisonment for drug offenses affects the nature and extent of the nation’s drug problems. To explore this question, The Pew Charitable Trusts examined publicly available 2014 data from federal and state law enforcement, corrections, and health agencies. The analysis found no statistically significant relationship between state drug imprisonment rates and three indicators of state drug problems: self-reported drug use, drug overdose deaths, and drug arrests.

The findings—which Pew sent to the President’s Commission on Combating Drug Addiction and the Opioid Crisis in a letter dated June 19, 2017—reinforce a large body of prior research that cast doubt on the theory that stiffer prison terms deter drug misuse, distribution, and other drug-law violations. The evidence strongly suggests that policymakers should pursue alternative strategies that research shows work better and cost less.

“Although no amount of policy analysis can resolve disagreements about how much punishment drug offenses deserve, research does make clear that some strategies for reducing drug use and crime are more effective than others and that imprisonment ranks near the bottom of that list. And surveys have found strong public support for changing how states and the federal government respond to drug crimes.”

“Putting more drug-law violators behind bars for longer periods of time has generated enormous costs for taxpayers, but it has not yielded a convincing public safety return on those investments,” concluded the study. “Instead, more imprisonment for drug offenders has meant limited funds are siphoned away from programs, practices, and policies that have been proved to reduce drug use and crime.”

My opinion? Public safety should be the number one reason we incarcerate. However, penalties should be the most effective, proportional, and cost-efficient sanction to achieve that goal. This would create more uniform sentences and reduce disparities, while preserving judicial discretion when necessary.

Please contact my office if you, a friend or family member face drug charges. If convicted, your loved ones risk facing an unnecessary amount of incarceration. Only a competent and experienced criminal defense attorney can reduce of criminal charges and/or facilitate the implementation of sentencing alternatives which reduce the amount of prison time an offender faces.

Increase of Uninsured Drivers in WA State

Informative article by Rolf Boone of The Olympian discusses how the number of uninsured motorists in Washington state increased to 17.4 percent between 2012 and 2015, according to the Northwest Insurance Council, which cited a report by the Insurance Research Council.

Washington state is now seventh highest in the country for uninsured drivers.

“It is concerning that in our region’s thriving economy, with more vehicles than ever on our roadways, that a growing percentage of drivers are uninsured, breaking the law and imposing higher costs on insured drivers,” said Kenton Brine, Northwest Insurance Council President in a statement.

The five states with the highest number of uninsured motorists:

-Florida, 26.7 percent.

-Mississippi, 23.7 percent.

-New Mexico, 20.8 percent.

-Michigan, 20.3 percent.

-Tennessee, 20 percent.

Under RCW 46.30.020, it is a civil infraction to drive without insurance. The legislative intent of this law says, “It is a privilege granted by the state to operate a motor vehicle upon the highways of this state. The legislature recognizes the threat that uninsured drivers are to the people of the state.”

Driving without insurance can be potentially damaging. Along with facing civil penalties, police officers may find some excuse to search your vehicle and/or investigate you for DUI, Driving While License Suspended, etc.

Please contact my office if you, a friend or family member face these or any other charges relating to driving. You may need competent defense counsel to get these charges reduced or dismissed.